You can view both exercise progress data and assessment data in graph or table form!
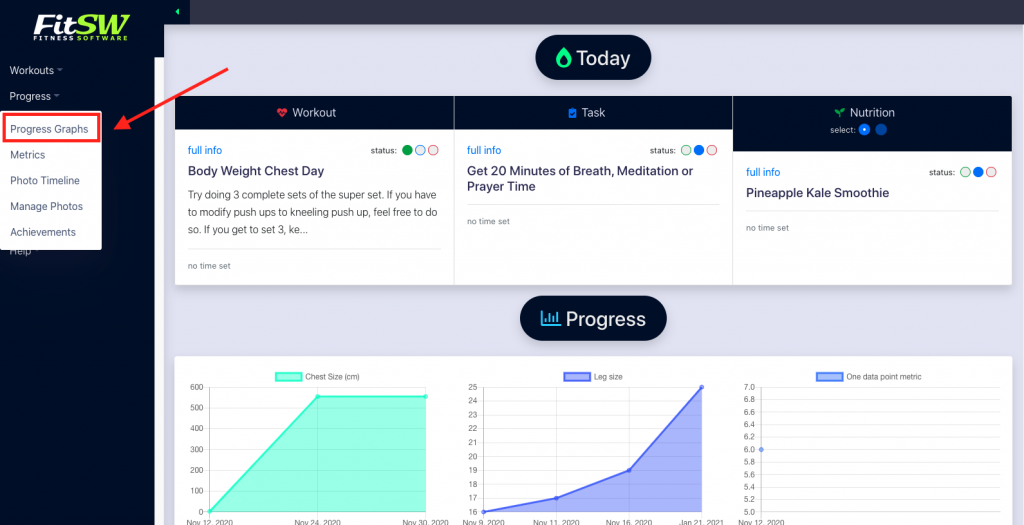
To view your progress graphs & tables, click the Progress button to the left of your screen. After this, a pull-down menu will appear. Click on the Progress Graphs button and you will be redirected to a new page. (See image below.)
You should now be on a page that is full of graphs showing you all the progress that has been made over your time using FitSW. If you would like to switch to Table Format, you can toggle your view between Graph Format and Table Format. (See image below.)

The progress and tracking graphs are created based on the values you or your personal trainer has entered into the assessment category. These can be based on an infinite number of various things that will only grow as your personal trainer and you increase the number of sessions you have.